
Reading population data
How to read and calculate population data: natural increase, density, pyramids and facts versus opinions. Read one part at a time and tap “I know this”. Then test yourself in the quiz.
Know it already? Jump straight to the quiz
Calculate with population data
- Natural increase = birth rate − death rate. 30 per 1 000 − 10 per 1 000 = 20 per 1 000.
- Population density = people ÷ area. 5 000 people on 100 km² = 50 people per km².
- If the death rate is higher than the birth rate, and nobody moves in, the population shrinks.
- The population growth rate is usually given as a percentage: if nobody moves in or out, divide the natural increase per 1 000 by 10. 20 per 1 000 = 2% a year: 2 more people for every 100 people each year.
Always read the unit: “per 1 000 people” or “per km²”.

Reading tables and pyramids
Compare countries in a table to see patterns. The country with the highest life expectancy, the lowest infant deaths and the most clean water usually has the best living conditions. If life expectancy rises from 55 to 65 years, better health care and clean water are the most likely reason.
- A census is an official count of all the people.
- An ageing population: a growing share of the people are old.
Fact or opinion?
A fact can be tested with data: “Country A’s life expectancy is 72 years.” An opinion is someone’s feeling: “Country C is the nicest place to live.” Good geographers keep the two apart.
Remember this and test yourself
- Natural increase = birth rate − death rate: 30 − 10 = 20 per 1 000.
- If the death rate is higher than the birth rate (and nobody moves in), the population shrinks.
- Population density = people ÷ km²: 5 000 ÷ 100 = 50 per km².
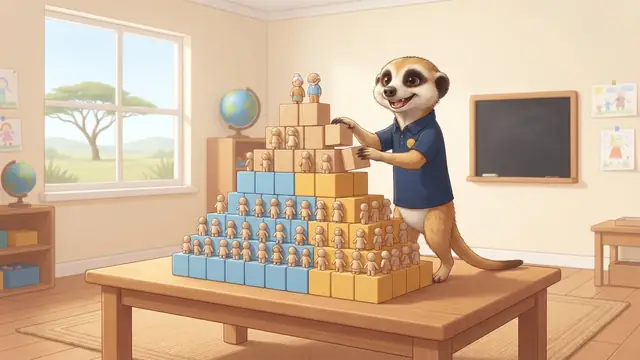
- A pyramid with a wide base and narrow top: many children, few old people.
- A fact can be tested; an opinion (“the nicest country”) cannot. Compare countries to see patterns.
Write these points in your book. Read them again the night before the test.

Natural increase = Births − Deaths. Density = people ÷ km².
Important words
First say what the word means, then turn the card over.
Match column A to column B
Tap a word in column A, then its meaning in column B. You can also start in column B.
True or false?
Read the question and the answer. Is the answer right? Tap True or False.

Now the real quiz!
The quiz has many more questions on this topic. Every question shows straight away whether you are right and explains why.
Take the quiz: Reading population data- Read one part together and ask your child to tell it back in their own words.
- The ticks (“I know this”) are saved on this device only. We never ask for names or emails.
Follows CAPS for Grade 7 Social Sciences (Geography). Always check your teacher’s notes and textbook too.