
Conservation, water and population growth
Conserving water in a dry country, wetlands and marine reserves, and how the world’s population grew over 2 000 years. Read one part at a time and tap “I know this”. Then test yourself in the quiz.
Know it already? Jump straight to the quiz
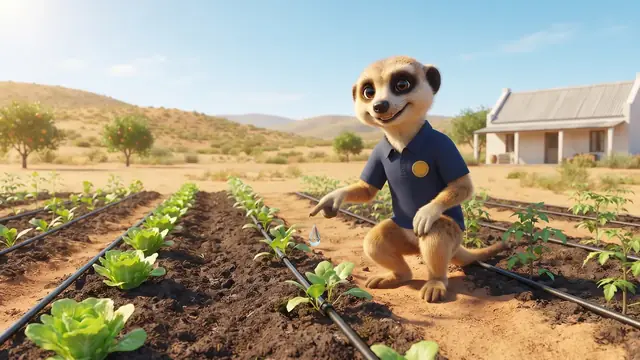
Water in a dry country
South Africa is water-scarce: our rainfall (about 450 mm a year) is only about half the world average (about 860 mm), and almost all our river water is already being used. Agriculture (irrigation) uses the most water. Water shortages hit poor communities hardest, because they cannot afford tanks or bought water.
Who uses our water? Agriculture about 60%, towns and homes about 27%, and the rest (about 13%) power stations, mines, industry, livestock and forestry. Pie graph: agriculture 60% of 360° = 216°; towns and homes 27% of 360° ≈ 97°.
- Households: fix leaks and take shorter showers.
- Farmers: use drip irrigation instead of flooding fields.
- Industry: reuse and recycle water inside the factory, and clean waste water before it goes back into rivers.
- An unhealthy river: dead fish, a foul smell and rubbish.
- Alien plants such as black wattle along rivers use lots of water and crowd out others.
Wetlands and the sea
Wetlands filter water and reduce floods, but about half of South Africa’s wetlands have already been lost or damaged. A catchment area is the land that drains into one river.
- Tsitsikamma in the Garden Route is Africa’s oldest marine protected area. In marine reserves fish can breed safely and recover.
- Eco-tourism is travel that protects nature and helps locals, with jobs for guides and cooks.
- Overfishing a species until few are left is misuse of a resource.
- Wetlands disappear when they are drained for farms and houses, polluted, or when their water is taken away.
- Case study: iSimangaliso Wetland Park around Lake St Lucia in KwaZulu-Natal is a World Heritage Site with hippos, crocodiles and many birds. It suffers when too much water is taken from the rivers that feed it.
- Caring for a catchment area: keep plants on riverbanks, remove alien plants, don’t dump rubbish or chemicals, and don’t build in wetlands.
2 000 years of population growth
For most of history the world’s population grew very slowly: hunger, dirty water and war kept the death rate high. Around 1800 there were about 1 billion people. It took about 125 years to reach 2 billion. After that better medicine, more food and clean water sped up growth, and in 2022 we passed 8 billion.
A graph that is almost flat and then shoots up steeply is called a J-curve.
- War raises deaths and makes people flee.
- China’s one-child policy (1980–2015) limited most families to one child to slow population growth. It has since ended, and families may now have up to three children.
- Some beliefs encourage large families.
Remember this and test yourself
- South Africa is water-scarce; agriculture (irrigation) uses the most water. Drip irrigation saves water.
- Wetlands filter water and reduce floods; about half have already been lost or damaged. Alien plants like black wattle use lots of water.
- Tsitsikamma is Africa’s oldest marine protected area; eco-tourism protects nature and creates jobs.
- World population grew slowly for centuries, reached about 1 billion by 1800, and passed 8 billion in 2022: a J-curve.
- Better medicine, more food and clean water sped up growth after 1800.
Write these points in your book. Read them again the night before the test.
The world’s population looks like a hockey stick (J-curve): long and flat, then suddenly steep.
Important words
First say what the word means, then turn the card over.
Match column A to column B
Tap a word in column A, then its meaning in column B. You can also start in column B.
True or false?
Read the question and the answer. Is the answer right? Tap True or False.

Now the real quiz!
The quiz has many more questions on this topic. Every question shows straight away whether you are right and explains why.
Take the quiz: Conservation, water and population growth- Read one part together and ask your child to tell it back in their own words.
- The ticks (“I know this”) are saved on this device only. We never ask for names or emails.
Follows CAPS for Grade 7 Social Sciences (Geography). Always check your teacher’s notes and textbook too.